35.
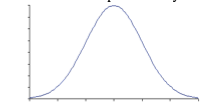
A typical curve for an enzyme catalysed reaction is given below. Y- axis depicts the rate of reaction, then X- axis will be represented by -
A:
Substrate concentration or pH
B:
Substrate concentration or temperature
C:
Substrate concentration or enzyme concentration
D:
pH or Temperature
The answer is:
D